The Goddess Gaia reflects on why the CO2 temperature forcing is logarithmic with concentration. An illustration of Climate Science's complexity, but, fortunately, Gaia knows best (Image created by Dall-E).
There is nothing to do about that: climate science is complicated. It is because Earth’s atmosphere is an entity that has no equivalent in our everyday experience. There is just no way to reproduce a huge mass of air that slowly becomes less dense and colder with height in a laboratory. You need a planet to create it, but we only have one planet, Earth, which has an Earth-like atmosphere.
Sometimes, that makes the debate on global warming an eerie illustration of the fact that a little knowledge can be dangerous. People jump into the debate like kamikaze pilots bent on destroying an aircraft carrier. And scientists, at times, react like flak gunners shooting at the sky. The result is a lot of noise, but, in the end, it is a counterproductive activity for everybody.
So, as an example, let’s consider an element of climate science that’s often discussed, but rarely explained. Why does the thermal “forcing” (and hence the temperature increase) depend logarithmically on CO2 concentration? It is an interesting example of how the atmosphere is an alien entity, poorly understood and often misrepresented.
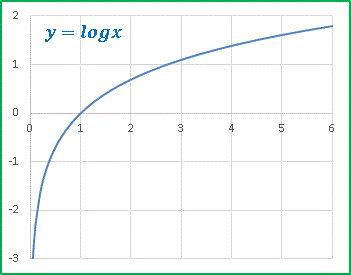
First of all, what does “logarithmic” mean? It means that the increase in temperature is not directly (or “linearly”) proportional to the concentration of CO2. This is the typical shape of a logarithmic curve. The x is the CO2 concentration, and y is the temperature. Note how growth slows down, but it never stops growing.
Why should that be? That’s one of those questions that open up a can of sandworms. But, as Leonard Cohen said, it is from a crack that light shines in. First, who said that the relation between temperature increase and CO2 had to be logarithmic? It is one of those things that everyone knows, but nobody knows why. Steve Mcintyre tried to find the source, but it seems that it disappeared in the midst of ancient literature (I know he is a “denialist,” but I follow the LETN rule: Listen to Everbody, Trust Nobody). McIntyre was right: my attempt to find the original source also failed. I asked various AIs, and the dumb things had no idea what they were talking about.
Several papers discuss the question, but all are rather recent and full of mathematical formulas. But the human mind doesn’t reason in mathematical terms. It reasons by analogies. Could we find an analogy that our brains can understand? Again, not easy at all. I tried to use a “blanket” analogy to explain the thermal effect of greenhouse gases, but that doesn’t give you a logarithmic expression. If you insulated your home, you were probably told that the thermal resistance of the insulation layer linearly depends on its thickness. Evidently, the atmosphere is a different story. Why?
In a future post, I’ll be sketching a few formulas that you can peruse as a simplified demonstration. But, as a rough approximation, you can imagine that the atmosphere warms the Earth as if it were a pile of blankets. Increasing the CO2 concentration (or of any other greenhouse gas) is equivalent to adding more blankets. Yet, since the atmosphere gets thinner with height, every new blanket added is less insulating than those below. Not great as an analogy, but that’s the best we can do. We just lack familiarity with objects that have no corresponding everyday equivalents.
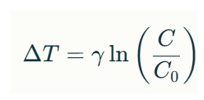
So we have this concept that the forcing (the heat added to the system) is supposed to be proportional to the logarithm of the CO2 concentration.
The proportionality coefficient is called the “climate sensitivity.” Obviously, it is a very important parameter that tells us how fast we are going to be boiled alive. It depends on several factors, including the feedback effect caused by water vapor, but let’s not go into that.
Now, all this reasoning is fine, but does it work? Good question. The answer is “maybe.” Strangely, plotting CO2 vs T is rarely seen, but some people did show graphs of that. Here is one provided by Robert Rohde. CO2 concentrations are from the Mauna Loa observatory, before 1959 they are from ice core data. Temperatures are from the Berkeley data set.
It is nicely logarithmic even though, of course, you could fit the same data with a straight line. They did exactly this at Clintel, (LETN). Let’s say that the data support the hypothesis within the uncertainty involved. A 2.3 centigrade increase for every doubling doesn’t seem to be so terribly bad, but take into account that this is the “transient” response; the long term trend could be much worse.
It doesn’t always work that way. Let’s see the data for the Pleistocene ice ages. Here are the data from the Vostok Ice Core.
There is a correlation, clearly, but it is strange that almost nobody ever bothered to plot temperatures vs CO2 concentrations. Eventually, I found a plot in a skeptical article, but I replotted the data myself just to make sure. Here is the result.
It is a complicated story, but the plot is not by any means logarithmic. Other ice core data, for instance from EPICA, give similar results. Note, incidentally, that the coefficient of proportionality is about 10 degrees C for every 100 ppm of CO2 concentration increase. Which is very, very bad, but let’s hope that this is something valid only for the Pleistocene.
But let’s move on. Here are some data about the whole Phanerozoic, the past 500+ million years, from a recent article by Judd et al.
Note the logarithmic scale of CO2 concentrations and, well, more or less, the correlation works. Except that for the whole Mesozoic it doesn’t work at all, something that Judd et al. define as a “conundrum.” Kind of.
So, is it logarithmic or not? The answer is a resounding, “it depends.” And it is not surprising that it is like that. Earth’s climate is a complex system, and complex systems are almost always impossible to describe with simple equations.
Think of a cat: what’s the equation of a cat? The cat obeys the laws of physics, but aside from that it can do whatever the hell it pleases. Step on its tail, and it may turn back and bite you. Or not — it depends. But a cat is still a cat.
So, the climate system will react to CO2 forcing in different ways, depending on how hard you step on its tail. As you may expect, it will do it differently depending on whether CO2 is a forcing or a feedback. During the ice ages of the Pleistocene, it was a feedback, not a forcing. At that time, changes in Earth’s temperaturee were triggered by solar irradiation oscillations and forced by albedo changes created by icecaps growing and shrinking. CO2 played a minor role in the story, although it further amplified the forcings.
In our times, CO2 emissions are a forcing, not a feedback. It is the CO2 emitted into the atmosphere that pushes the temperature to higher values. Something similar happened during the Cenozoic, when the CO2 drawdown caused by the silicate erosion reaction drove temperatures to the low levels of the Pleistocene. So, we expect a logarithmic dependence.
In the end, CO2 is just one of the many elements of the giant climate creature that defies attempts to code in simple equations. But be careful; when the creature bites back, you die. And, as usual, Gaia knows best.


Yeah, the Mesozoic had a wide variation in Temperature, coupled with a stable CO2 concentration.
That jumped right out at me.
Wuzzup widdat?
Maybe the answers can be found in the rate of sedimentary deposition stalagmite formation in relation to the increased rainfall patterns from increased atmospheric water circulation. Lower clouds have a much larger albedo effect than higher clouds and one would think increased rain bearing lower cloud mass in a warmer world would allow increase concentrations of co2 without increased warming due to the faster heat release cycle of rain forming clouds. There are some interesting articles on temperature and cloud / rain formation and the release of energy from the earths biosphere. Many thanks